
THE GANTT CHART AND ITS ROLE IN PROJECT MANAGEMENT
The Gantt chart is still an essential part of planning projects and monitoring their implementation. Below we will look at the easiest ways to create a Gantt chart in Excel, what other software has this functionality, and what dedicated Gantt charting software can be downloaded from the web.
A project is usually made up of several subtasks, and project management can be defined as the planning, scheduling and execution of the activities that make up a project as a process. The first step is therefore planning, for which modelling is the basic tool.
A symbolic model gives project participants a better overview of the different subtasks, their logical, chronological and other relationships, and any deviations from the schedule during implementation. A well-chosen model also makes it easier to identify, eliminate and solve any backlogs or problems that may arise during the project.
One of the oldest and still classic models used in project management is the Gantt chart. The following is an overview of its features, functions and how it is constructed, among other things.
THE CONCEPT OF THE GANTT CHART
The Gantt chart was developed by Henry L. Gantt between 1910 and 1915. His aim was to make the US Navy's shipbuilding programme more efficient.
A Gantt chart is essentially a line schedule that shows where the subtasks of a project are at any given moment in time. The horizontal axis of the Gantt chart is the time line, and the vertical axis is the sequential workflow of the project. The Gantt chart makes it easy to see the planned activities within a given timeframe and the interrelationships between the interdependent subtasks.
The chart is also easy to read and understand:
- the starting date and deadline for each subtask,
- the current status of each subtask, for example, which subtasks are experiencing backlogs or are behind schedule,
- the relationship of each work process to the other over time,
- the activities that can be carried out in parallel,
- further links between the different subtasks.
If necessary, the Gantt chart makes it easier to reschedule individual subtasks, to overcome possible shortages of material, human or other resources, or to optimise the project based on the available resources. It also helps to ensure that individual activities are carried out as quickly, efficiently and smoothly as possible.
Making a Gantt chart
The diagram can be created using a variety of software. However, the most common and popular interface for creating Gantt charts is Excel, so we will look at this in more detail.
How to create a Gantt chart in Excel
The first step in creating a diagram is to break down the project that the diagram will represent into subtasks. These will form the activities depicted on the vertical axis of the diagram. It is equally important for planning purposes that these tasks have a start date and a deadline, as we can position them accordingly on the horizontal time axis.
In the past, Excel did not have a dedicated Gantt chart option, so it was possible to create a Gantt chart in many steps (starting from the "Cumulative Bar Chart" or using the Chart Wizard). Fortunately, a Gantt chart template is now available, which can be accessed in the latest Excel under "File" in the templates section, or also downloadable here.
Gantt chart - example
The Excel template mentioned in the previous paragraph looks like this:
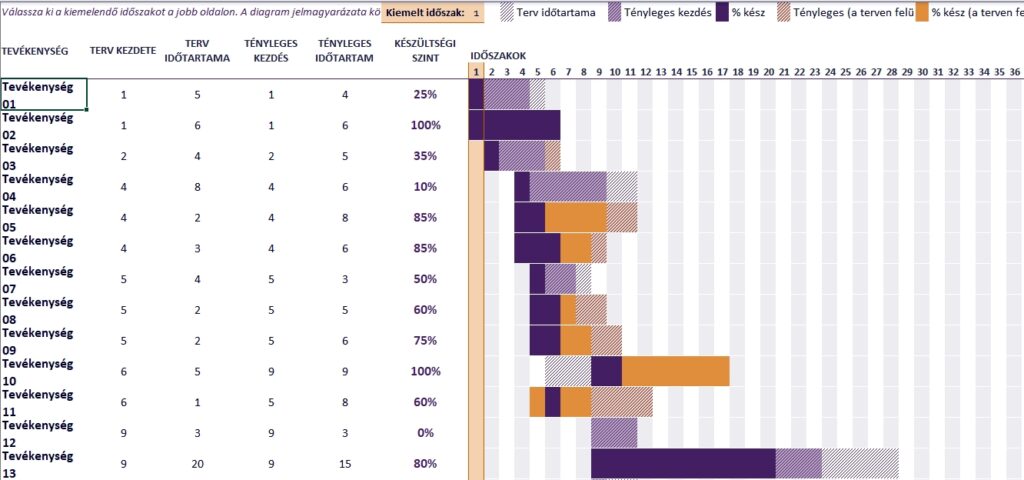
The template is in fact a ready-made Gantt chart pattern that you just need to fill in with the appropriate data.
If you enter the subtasks and dates of the given project in the appropriate cells, you will be able to read the subtasks on the chart:
- scheduled start date,
- planned duration,
- actual start date,
- actual duration,
- the current level of preparedness,
- and its degree of preparedness compared to the planned.
THE GANTT CHART IN OTHER PROGRAMS AND APPLICATIONS
To this day, the Gantt chart is an integral part of project management, as evidenced by the fact that it is used by and available in a variety of scheduling, task management apps, sites and software.
Some examples:
- Asana
- Just Doo
- Microsoft Project Online
- Easyproject
- EasyRedmine
- mProject Viewer
- MyProject
- ProjectPlan365
- Project Studio
GANTT-CHART EDITING PROGRAMS
There is also software specifically for Gantt charting, such as:
- Gantt Chart Designer
- Gantt Chart Maker
- GanttMagic
- GanttPro
- IntelliGantt for Office 365
- SimpleGantt 10
GANTT CHART MAKER DOWNLOAD
There are several Gantt chart makers available for download on the internet. One such is Gantt Chart Designer, an older, small but still very usable program that runs on the latest Windows and is easy to use. Download here.
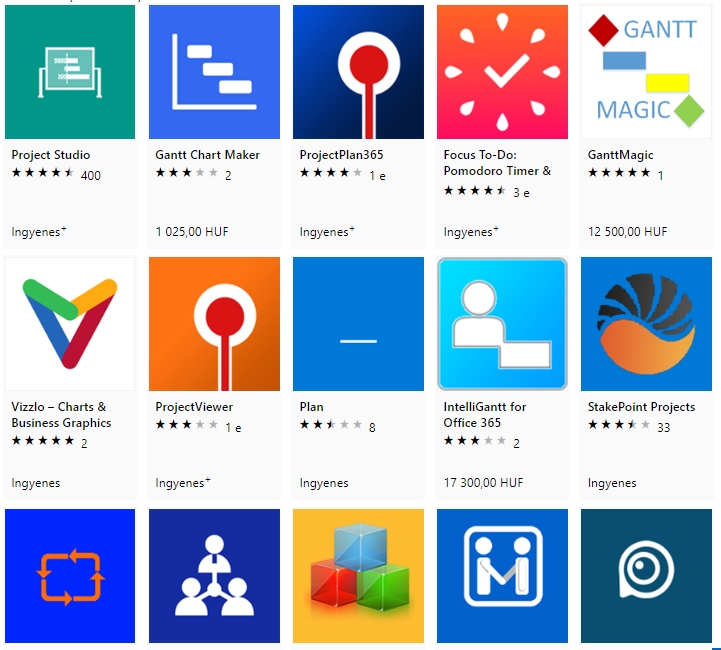
Other free Gantt chart makers and project management software with Gantt chart functionality (including most of the free ones) available for download from the Microsoft website.
DON'T STOP AT THE GANTT CHART - LEARN MORE ABOUT PROJECT MANAGEMENT
Although the Gantt chart is still used today, it has evolved and modernised a lot since the early 1900s. This is also true for project management itself, which is one of the most dynamically evolving disciplines. You can effectively expand your knowledge in this field through well-chosen training provided by highly qualified and experienced professionals from a professional consultancy firm.
If you are interested, please contact us by e-mail at info@promanconsulting.hu or by telephone on +36 30 6632069 or find out more about our training courses on our website.
Contact us, try one of our training courses and benefit from new skills at individual, team and organisational level!
