The BCG matrix is one of the most widely used and best-known methods of strategic analysis. The method is not new, having been developed in 1968 by the Boston Consulting Group (hence the acronym BCG), but its validity is still unquestioned in today's digitally transformed market environment. But what is the BCG matrix and how do we use it?

What is the BCG matrix?
The BCG matrix is a strategic analysis method used to analyse a company's products, product lines, services or even entire business units.
The analysis is based on the following factors:
- The rate of market growth
- Relative market share
For this reason, the BCG matrix is also called the growth-share matrix.
Objectives of the BCG matrix
- Market positioning of the company's products
- Determine the strategy to be applied based on the product lifecycle and market positioning
- Developing the optimal product portfolio for the company
Categories of the BCG matrix
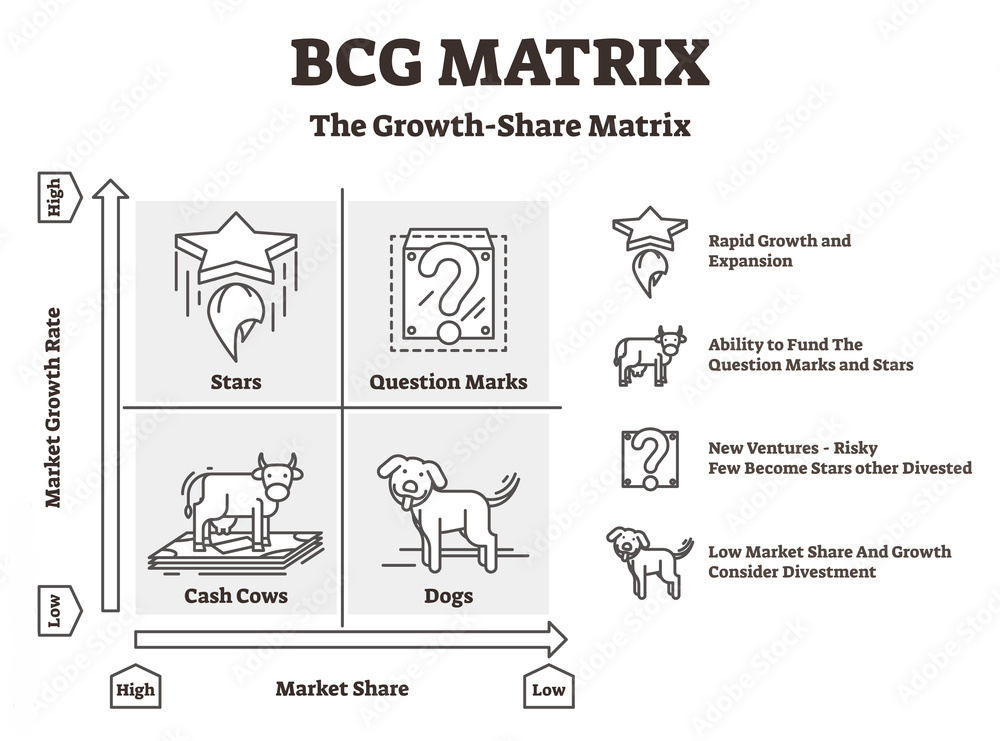
In the analysis, the product, product line, service or industry analysed can take low and high values in terms of relative market share and market growth.
This results in the following 4 categories:
- Stars: high market share + high market growth
- Question marks: low market share + high market growth
- Cash cows: high market share + low market growth
- Pets (dogs): low market share + low market growth
Stars
The stars are the products, product lines, services or industries that are clearly in the best strategic position due to their high relative market share and the ever-expanding market. These may include first-to-market products in a given category and monopolies.
Their cash-generating capacity is very high, but they are not necessarily profitable at the moment because of the high costs of serving the needs of an ever-expanding market and defending against competitors' attacks. The stars are in a phase of strong growth and turbulent competition on the product life curve.
The stars set the main direction of the company's product portfolio. The aim is to maintain their success and become a bellwether, thereby generating as much profit as possible. The right strategy is therefore to maintain or grow.
Cash cows
Cash cows are those products, product lines, services or industries where high market share is associated with low market growth prospects. These products are at the maturity stage of the product life curve.
Such products bring the high profits, cover the R&D and marketing costs, and further develop the question marks to become market leaders.
The strategic objective in this case is to keep the cash cows in this position for as long as possible. So the strategy to be used is to maintain the level and maximise profits.
Question marks
Question Marks are products, product lines, services and industries that have a small market share but are in a dynamic growth market.
That's why question marks have great growth potential and can become stars. However, they require a large investment and are not yet profitable. Question marks are products that are at the launch stage of the product life curve.
In their case, the right strategy is to continue to grow and invest, but if market conditions are unfavourable, then the choice is to retreat.
Dogs
Dogs are products, product lines, services or industries where there is neither a large market share nor a growing market.
They get their name from the fact that they were once cash cows and are therefore nostalgically cherished as a favourite pet, but are actually more of a loss. These units or products are at the end of the decline stage of the product life curve.
In their case, the correct strategy is usually to withdraw. However, there may also be a situation where dogs prevent competitors from monopolizing or new entrants from entering. In such cases, the strategy of maintaining the level should be used.
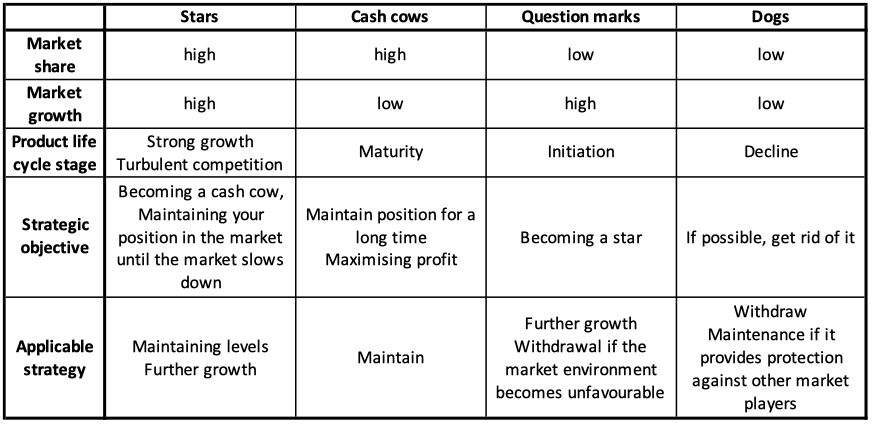
Comparison of the BCG matrix categories
Advantages and disadvantages of the BCG matrix
Advantages of the BCG matrix:
- Easy to prepare
- An excellent tool for developing a product development strategy
- Gives an easy-to-interpret result
Disadvantages of the BCG matrix
- Not suitable for a full analysis, as it only takes into account two factors
- Not suitable for long-term analysis in a rapidly changing environment
- Does not take into account the expected or real reactions of competitors
The BCG matrix is therefore a very illustrative and effective tool for strategising. However, it is important to review the results at regular intervals and to use them in combination with other analytical methods (e.g. PESTEL analysis).
Have a question? Contact us!
If you have any questions about more effective strategic planning or other areas of project management, please contact us. contact. Contact us for a free consultation!